The bears showed today that they have plenty of growl left, sending the Dow and S&P to new closing lows and the stock market to its fifth 90% downside volume day since June. This heavy selling will eventually help the market form a major bottom — but we need a 90% upside day for a signal that the process is complete, otherwise the risk remains to the downside.
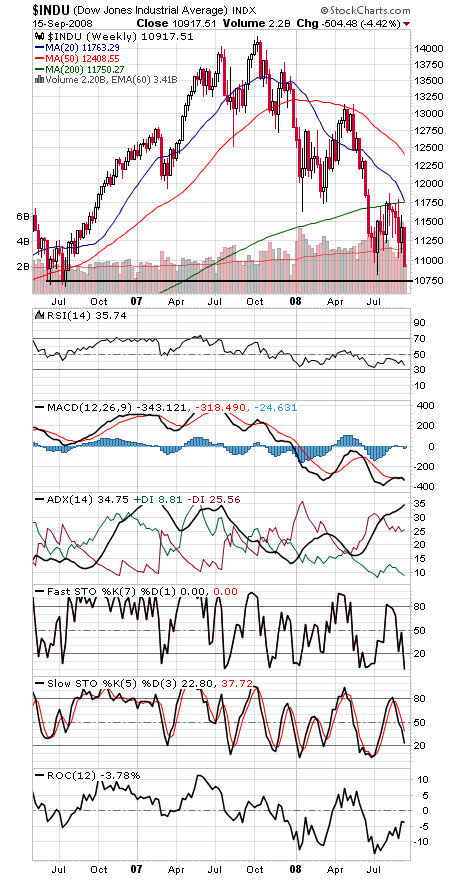
We are coming up on very important support in the 10,670-10,827 area on the Dow (first chart below), the index’s 2006 lows (and early 2004 peak).
Why is this level so important? We will restate our long-running observation on the importance of mid-term election year lows. Since 1934 (basis the Dow), they’ve held until the next mid-term low four years later, and if broken decisively, broken only at the end of the next four-year cycle low (1974, 2002). 1947-1949 saw multiple tests and even a breach or two of the 1946 low, but it essentially held.
The last time a mid-term year failed to hold up was 1930, a bit of history we sure don’t want to repeat.
The phenomenon likely has to do with the effectiveness of monetary policy — if efforts to stimulate the economy in the two years leading up to the presidential election are effective, then the lows of the weakest part of the cycle should hold.
We’re sure testing both the effectiveness of monetary policy and the strength of that mid-term low here.
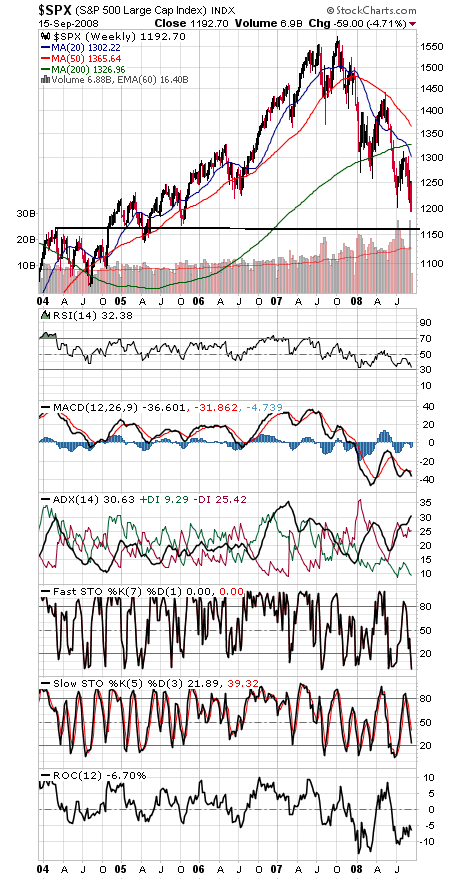
The S&P (second chart) has already taken out the 2006 low; next up is 1155-1163, the early 2004 peak. To the upside, 1220 and 1230-1237 are resistance on the S&P, and 11,081-11,261 on the Dow.
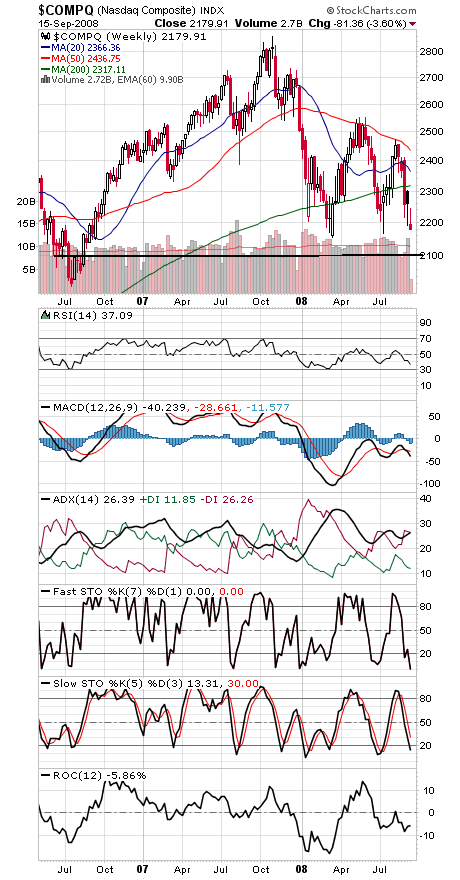
The Nasdaq (third chart) has support at 2155-2167 and 2100, and 2200, 2225 and 2245 are resistance.
Paul Shread is a Chartered Market Technician (CMT) and member of the Market Technicians Association.